2:14 AM. The release train is halted, my manager is typing in Slack, and one pod in the api-server Deployment has been sitting in Pending for 45 minutes. Not crashing, not erroring, just Pending. I run kubectl get pods for the tenth time like the status might change out of sympathy. It does not.
The Deployment rolled out clean. The image pulled. The replica count moved from 3 to 4. And then the fourth pod just sat there, quietly refusing to exist. No logs to read, because the container never started. No events on the Deployment, because the Deployment did its job. The pod is healthy in every way except the one that matters: it is not running anywhere.
I take a breath and go talk to the scheduler yaar. That is where Pending lives.
The scenario
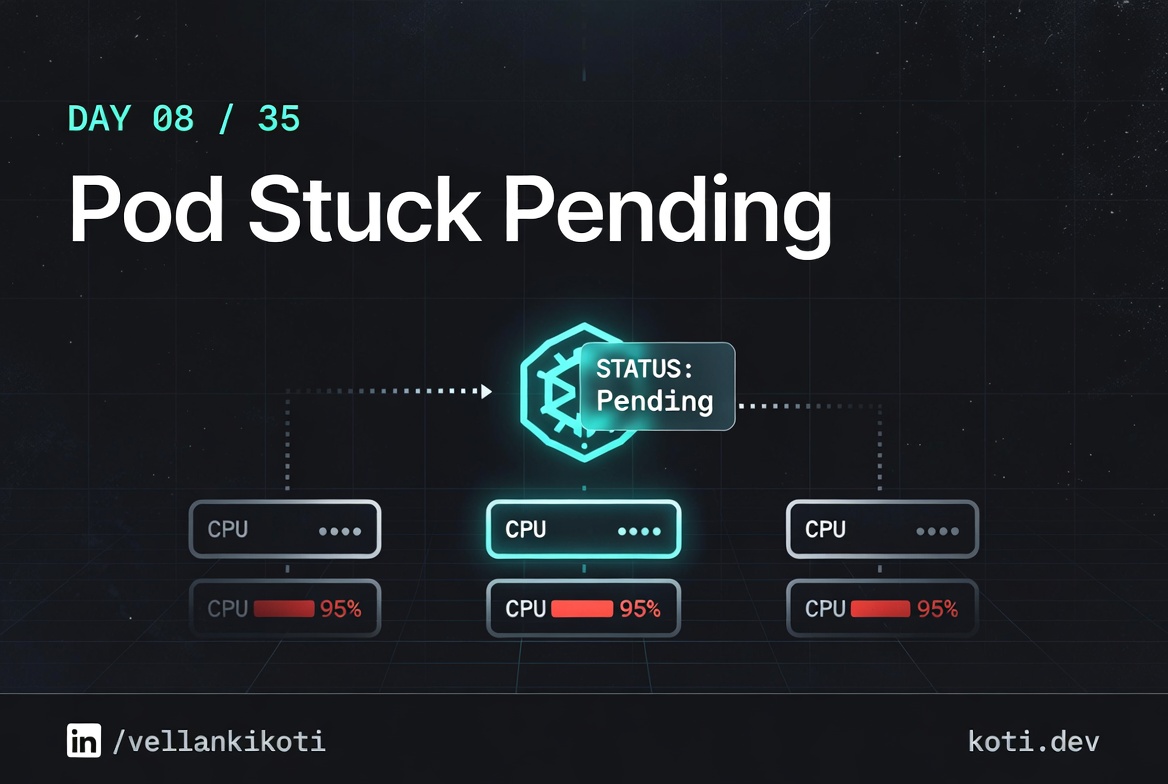
The pod exists. No node will take it.
The kube-scheduler ran its filter loop on all three nodes and rejected every one. The pod's nodeAffinity requires tier=premium — a label none of the nodes carry. The pod will stay Pending until a matching node appears or the affinity is removed.
The pod carries an unsatisfied affinity
Its spec includes nodeAffinity: tier=premium. The scheduler must find a node where that label is present before it can bind the pod. Until then the pod sits in Pending — it exists in etcd, but no kubelet knows about it.
No node carries the required label
All three nodes were labelled at cluster creation: two with tier=standard, one with tier=basic. The filter loop rejects every candidate. Check current labels with kubectl get nodes --show-labels.
The scheduler logs the predicate failure
Run kubectl describe pod api-client and scroll to Events. You will see 0/3 nodes are available: 3 node(s) didn't match Pod's node affinity. That single line tells you the exact predicate — no log diving needed.
This is the exact shape of the problem, pulled from Day 0's cluster and the scenarios repo. You should already have a running cluster from Day 0; if not, spin one up with kind or minikube first.
git clone https://github.com/vellankikoti/troubleshoot-kubernetes-like-a-pro.git
cd troubleshoot-kubernetes-like-a-pro/scenarios/insufficient-resources
lsYou will see description.md, issue.yaml, fix.yaml, and a helper script. The interesting files are issue.yaml, which asks for more CPU and memory than a typical dev cluster has, and fix.yaml, which asks for a sane amount.
Reproduce the issue
Apply the broken manifest and watch the pod get stuck.
kubectl apply -f issue.yaml
kubectl get pod insufficient-resources-podNAME READY STATUS RESTARTS AGE
insufficient-resources-pod 0/1 Pending 0 38sThirty-eight seconds, one minute, five minutes. The status never moves. That is the signal. A pod that is genuinely starting will flip through ContainerCreating in under a minute on a healthy cluster. A pod that stays in Pending past a minute is almost always a scheduling problem, not a runtime problem.
Debug the hard way
The first command I reach for is describe, because Pending problems live in the Events section.
kubectl describe pod insufficient-resources-podScroll past the spec, the volumes, the conditions, and land on Events:
Events:
  Type     Reason            From               Message
  ----     ------            ----               -------
  Warning  FailedScheduling  default-scheduler  0/1 nodes are available:
                                                1 Insufficient cpu,
                                                1 Insufficient memory.
                                                preemption: 0/1 nodes are
                                                available: 1 No preemption
                                                victims found for incoming pod.
Read that line carefully. 0/1 nodes are available. The scheduler checked every node in the cluster and rejected every one of them. The reason is broken down per filter: one node failed the CPU filter, the same node failed the memory filter. Kubernetes is telling you exactly which predicate fired.
Now I want to see what the pod is asking for and what the node actually has.
kubectl get pod insufficient-resources-pod -o jsonpath='{.spec.containers[0].resources}'{"requests":{"cpu":"2","memory":"4Gi"}}Two whole CPUs and 4 gigs of memory, for a sleep 3600. Now the node side:
kubectl describe node | grep -A 5 "Allocated resources"Allocated resources:
Resource Requests Limits
cpu 850m (85%) 1 (100%)
memory 512Mi (32%) 1Gi (64%)The node has about 150 millicores of CPU headroom. The pod is asking for 2000. It does not fit. It will never fit. The scheduler is not broken, it is being honest.
Why this happens
The Kubernetes scheduler is a filter-and-score loop. For every unscheduled pod, it walks the node list, runs a set of predicates (CPU, memory, taints, affinity, volumes, ports), and throws out any node that fails any predicate. Whatever survives gets scored, and the highest score wins. If nothing survives, the pod stays Pending and the event log gets one FailedScheduling line.
The subtle part is that the scheduler compares against requests, not against actual usage. A node with 4 CPUs that is sitting at 5% utilisation will still refuse a pod asking for 3 CPUs if other pods have already requested 2. Requests are a reservation system. The scheduler is enforcing the reservation, not the live load.
This is also why "just restart it" never works for Pending pods. The scheduler is deterministic about this. Until something changes, either the pod's requests shrink or the cluster's capacity grows, the answer will be the same.
The fix
One label. Pod scheduled.
Adding tier=premium to node-2 gives the kube-scheduler exactly one candidate that passes the nodeAffinity predicate. The pod binds immediately and transitions from Pending to Running in seconds.
One label command unblocks the scheduler
Running kubectl label node node-2 tier=premium is the entire fix. The label is written to the node object in etcd. The scheduler's next filter pass — which happens within seconds — finds node-2 as the sole qualifying candidate.
Pod transitions Pending → Running
Once the scheduler binds the pod to node-2, the kubelet on that node pulls the image and starts the container. The pod's status.phase flips to Running — usually within 10 seconds on a warm image cache.
Nodes 1 and 3 are untouched
The other nodes keep their original labels. If the affinity required tier in (standard, premium) all three would qualify. Narrowing to tier=premium is a deliberate choice — pin to it only when the workload genuinely needs that hardware tier.
Two paths. Shrink the pod or grow the cluster. For this scenario the pod is a toy, so shrinking is the right call.
kubectl apply -f fix.yaml
kubectl get pod insufficient-resources-fixed-podNAME READY STATUS RESTARTS AGE
insufficient-resources-fixed-pod 1/1 Running 0 6sThe diff that matters:
resources:
  requests:
    cpu: "100m"      # was "2"
memory: "64Mi" # was "4Gi"Six seconds from apply to Running. The scheduler was never the bottleneck, the request numbers were.
The lesson
- Pending is a scheduling verdict, not an error. Read the
FailedSchedulingevent before anything else. - The scheduler compares against
requests, not live usage. A quiet node can still reject a greedy pod. - Every Pending pod ends in one of three fixes: shrink the request, free up capacity, or relax a constraint. Figure out which before you touch any yaml.
Day 8 of 35 — tomorrow, a pod anti-affinity rule that the scheduler can never satisfy, no matter how many nodes you add.