2:18 AM. A load test is meant to be running. Marketing is sending traffic at 9 AM and we need to know the new service can take it. I open kubectl get pods and see eighteen of twenty replicas stuck in Pending. The autoscaler should have woken up by now. It has not. The node count is the same as it was an hour ago. I am about to start swearing at AWS when I remember that the autoscaler is not magic, it is just a controller watching unscheduled pods and deciding whether a new node would help. And if it decided that a new node would not help, it would not scale. The question is why it decided that.
There are four signals I check in order, every single time, and they tell me which of the usual suspects is the problem.
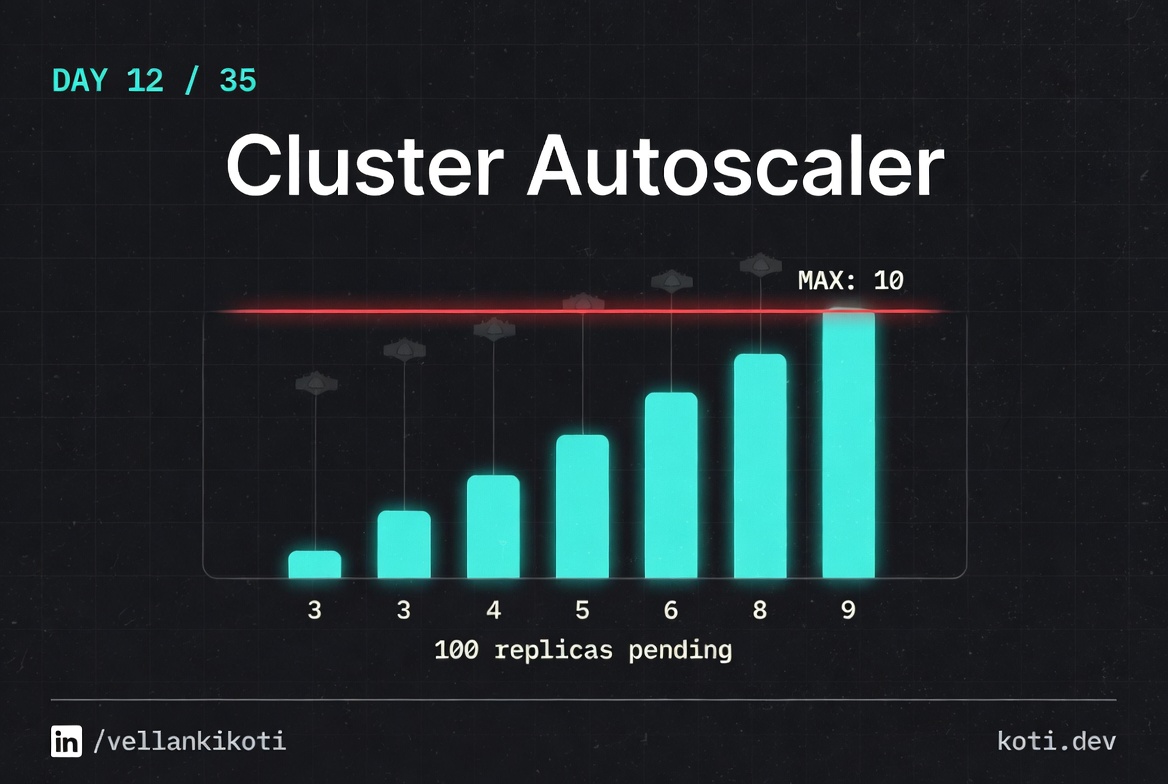
The autoscaler wants to scale. The node group is at max.
A pending pod requests 4 CPU. Cluster Autoscaler evaluates whether adding a node would help, but the node group has already hit its configured max-size of 5. CA logs 'would expand but max-size reached' and does nothing. The pod stays Pending. The fix is to raise max-size — not to debug the pod.
The pod is Pending because no node has enough free CPU
The pod requests cpu: 4. Every node in the cluster is at full CPU utilisation. The scheduler emits 0/5 nodes available: Insufficient cpu. This is the signal Cluster Autoscaler watches — it should respond by adding a node.
All five nodes are saturated — there is nothing to reclaim
The cluster has reached its node count limit. Every node shows cpu free: 0m after accounting for system overhead and running workloads. CA simulates adding one new node per node group and checks whether the pending pod would fit — it would, but only if the node group's max-size allowed a sixth node.
CA is correct to do nothing — raise max-size to unblock
Cluster Autoscaler respects the node group's max-size as a hard ceiling. It logs No expansion options and stops. The fix is to increase the max-size in the cloud provider's node group (AWS ASG, GCP MIG, or Azure VMSS), not to restart the autoscaler or modify the pod. Verify the current limits with kubectl logs -n kube-system deployment/cluster-autoscaler | grep max-size.
The scenario
git clone https://github.com/vellankikoti/troubleshoot-kubernetes-like-a-pro.git
cd troubleshoot-kubernetes-like-a-pro/scenarios/cluster-autoscaler-issues
lsdescription.md, issue.yaml, fix.yaml, autoscaler_issue.sh. The issue manifest creates a Deployment with 20 replicas, each asking for 500 millicores and 256 megabytes. On a small dev cluster, most of those will pile up in Pending.
Reproduce the issue
kubectl apply -f issue.yaml
kubectl get pods -l app=cluster-autoscalerNAME READY STATUS AGE
cluster-autoscaler-issue-deployment-6b7cf9c5f9-2fq8p 1/1 Running 30s
cluster-autoscaler-issue-deployment-6b7cf9c5f9-4lmxc 0/1 Pending 30s
cluster-autoscaler-issue-deployment-6b7cf9c5f9-7h2vj 0/1 Pending 30s
cluster-autoscaler-issue-deployment-6b7cf9c5f9-8k9rn 0/1 Pending 30s
... 16 more Pending ...One or two running, the rest sitting in Pending. On a real cluster with an autoscaler, this is the exact state right before the autoscaler is supposed to act.
Debug the hard way
Signal one, the scheduling event. What does the scheduler say about the Pending pods?
kubectl describe pod -l app=cluster-autoscaler | grep -A 3 FailedScheduling | head -10Warning FailedScheduling default-scheduler 0/1 nodes are available:
1 Insufficient cpu.Insufficient CPU. Good, that is what an autoscaler is for. Signal two, the node count:
kubectl get nodesNAME STATUS ROLES AGE
kind-control-plane Ready control-plane 2hOne node, still. The autoscaler has not added any. Signal three, the autoscaler logs. In a real cluster you would run:
kubectl logs -n kube-system deployment/cluster-autoscaler | tail -30I0331 02:20:11 scale_up.go:452] No pod can be scheduled even if a node group
is expanded to maximum size.
I0331 02:20:11 scale_up.go:310] No expansion options.That is the line that matters. The autoscaler looked at the pending pods and said "even if I add a node of the biggest allowed size to every node group I manage, these pods still would not fit." Signal four, the node group config. If the max size is 1, or the instance type is too small for a 500m request plus system overhead, the autoscaler has no move to make.
Why this happens
Cluster autoscaler works at the node group level, not the cluster level. For each node group, it knows the max size, the instance type, and the resources that a fresh node would provide. When a pod is Pending, the autoscaler simulates adding one new node to each group and checks whether the pod would then fit. If yes, it scales. If no, it logs and moves on.
The silent failure modes are all about that simulation. A node group capped at its max will be skipped. A node group whose instance type cannot hold the pod's requests will be skipped. A pod with an affinity rule that pins it to a label no group provides will be skipped. A pending pod with a PVC stuck in the wrong zone will be skipped. In every case, the autoscaler is not broken, it is correctly refusing to scale up something that would not solve the problem.
The fastest way out of this debug loop is to treat the autoscaler like a scheduler in its own right. Read its logs, not just the pod events.
The fix
For this scenario, the replicas are a lie. Nobody needs twenty busybox sleeps. The fix drops the count to three and the request to something sane.
kubectl apply -f fix.yaml
kubectl get pods -l app=cluster-autoscalerNAME READY STATUS AGE
cluster-autoscaler-fixed-deployment-7c8d5f4b9d-abcde 1/1 Running 5s
cluster-autoscaler-fixed-deployment-7c8d5f4b9d-fghij 1/1 Running 5s
cluster-autoscaler-fixed-deployment-7c8d5f4b9d-klmno 1/1 Running 5sThe diff that matters:
replicas: 3          # was 20
resources:
  requests:
    cpu: "100m"      # was "500m"
memory: "64Mi" # was "256Mi"In a real incident the fix is rarely the replica count. Usually it is the node group's max size, or the instance type, or an affinity rule that pins the pods to a group that is already full.
The lesson
- Autoscaler silence is almost always a deliberate decision. Read its logs before you restart anything.
- The four signals are always the same: pod events, node count, autoscaler logs, node group config. In that order.
- The autoscaler simulates a single new node per group. If one new node would not fix the pod, the autoscaler is correct to do nothing.
Day 12 of 35 — tomorrow, a resource spec where the limit is smaller than the request, and the one error message Kubernetes gets right.